
Introduction
Do you spend hours each month hunting down performance data, only to discover your Balanced Scorecard shows last month’s reality instead of today’s performance? Most strategy professionals waste valuable time in endless data collection cycles that produce reports feeling outdated before anyone reviews them.
Manual scorecard management creates dangerous blind spots. When your data contains weeks-old information or calculation errors, you miss critical performance shifts that could signal emerging problems or missed opportunities.
Spider Impact transforms your Balanced Scorecard from a static monthly burden into a dynamic, real-time strategic tool. You’ll eliminate manual updates while gaining instant visibility into what drives your organization’s success.
Main Takeaways
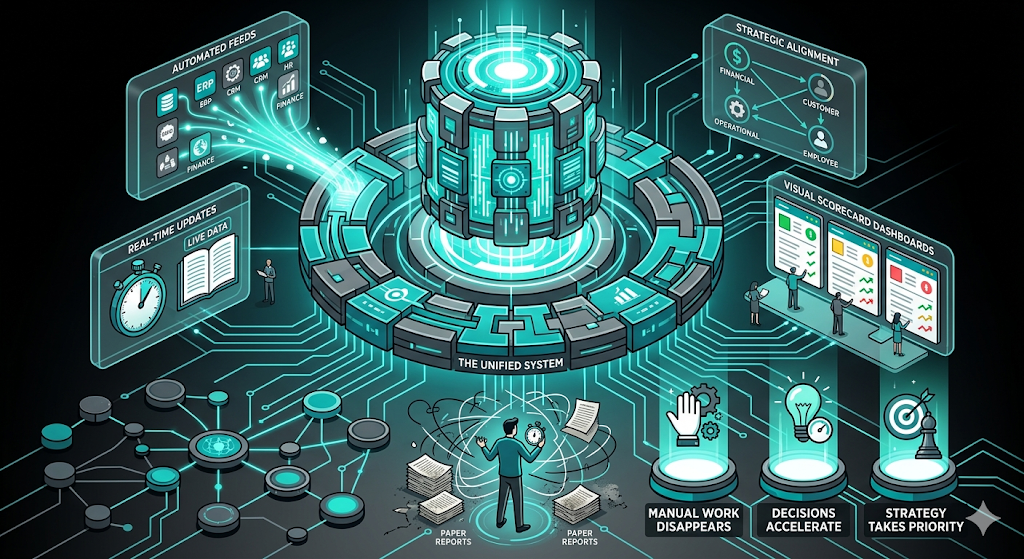
Manual Work Disappears: Automated data integration eliminates time-consuming updates and reduces reporting errors, freeing your team from tedious collection tasks.
Decisions Accelerate: Real-time data feeds enable faster, better-informed decisions based on current performance rather than outdated monthly reports.
Strategy Takes Priority: Technology handles data entry automatically, allowing your team to focus on strategic analysis and improvement initiatives that drive measurable results.
Integrated Platform Benefits for Balanced Scorecards
Your organization’s performance data lies scattered across countless systems, making strategic visibility nearly impossible to achieve.
Integrated platforms connect all scorecard components into a unified system that drives strategic alignment. You eliminate the chaos of juggling separate financial spreadsheets, customer satisfaction surveys, operational reports, and employee development trackers. Instead, your teams access one centralized system that reveals how these elements work together. This approach removes version control nightmares and data inconsistencies that plague manual scorecard management.
Real-time data integration transforms how quickly your organization responds to changing conditions. The Pew Research Center notes that “nearly every large company has a real-time data warehouse and has more timely data on the economy than our government agencies.” Automated feeds from your existing business systems ensure KPIs update continuously, pulling fresh information from sales databases, customer service platforms, and operational systems without human intervention. These automatic calculations eliminate delays and errors that occur when teams manually compile quarterly reports, giving leaders current information precisely when strategic decisions need to happen.
These unified systems reveal cause-and-effect relationships that scattered data conceals. When financial performance, customer metrics, internal processes, and learning initiatives operate within the same system, patterns emerge that show how improvements in employee training influence customer satisfaction, or how operational efficiency gains drive profitability. Pew Research Center research indicates that “AI can analyze large amounts of data and identify patterns that humans may not be able to detect” to help policymakers make better decisions. This visibility enables your organization to make strategic adjustments based on actual performance connections rather than assumptions.
These foundational benefits set the stage for transforming complex data into instantly recognizable visual indicators that accelerate your decision-making speed.
Visual Performance Indicators for Quick Decision-Making
While your competitors struggle through dense spreadsheets and complex reports, you can leverage visual performance systems that transform data interpretation from minutes into seconds, enabling rapid strategic responses that capture fleeting market opportunities.
Your brain processes visual information exponentially faster than text or numbers, making visual performance indicators essential for rapid strategic assessment. Pew Research Center notes that emerging digital systems will become integrated into daily routines, empowering individuals to make more informed decisions and resolve problems with unprecedented speed and accuracy. Color-coded scoring transforms overwhelming data sets while eliminating the mental burden of interpreting numerical ranges and percentages. Red indicators signal urgent attention requirements, yellow suggests caution or monitoring needs, and green confirms performance meets or exceeds expectations, allowing you to identify priority areas within seconds.
Dashboard views consolidate multiple scorecard perspectives into unified displays that reveal your complete performance picture. Instead of switching between separate reports for financial metrics, customer satisfaction scores, and operational efficiency measures, you see how all strategic dimensions interact on a single screen. These integrated visualizations often expose patterns and relationships that remain hidden when data exists in isolated reports.
Trend analysis charts display performance trajectories that highlight whether your improvements accelerate, maintain steady progress, or decline. The democratization of information access mirrors broader technological shifts where, as noted by Pew Research Center, what once took prestigious scholars half a year to obtain can now be accomplished in minutes. This real-time visibility allows you to proactively address issues, reallocate resources to high-performing channels, and capitalize on emerging opportunities before competitors respond.
These visual capabilities become even more powerful when supported by automated platforms that eliminate the manual data compilation you traditionally needed for meaningful performance insights.
Spider Impact for Balanced Scorecard Management
Automated integration capabilities connect your existing business systems directly to your scorecard, creating live data feeds from financial platforms, CRM systems, and operational databases. Research shows that automation saves almost 160,000 hours annually across administrative functions, while also reducing contract completion time by up to 80%. These live data connections eliminate manual data entry while freeing your analytical talent to focus on strategic initiatives that drive growth. You can track metrics measuring reduction in manual effort and time savings as key automation improvements that reduce operational costs and speed up data delivery.
The platform’s intuitive design ensures your team navigates dashboards and accesses performance insights without lengthy training periods. Clear visual layouts and straightforward controls make complex strategic information accessible to executives reviewing high-level trends and department managers drilling into operational details. This accessibility removes the typical learning curve that often delays scorecard adoption across organizations.
Customizable reporting capabilities allow you to tailor scorecard presentations for different stakeholder groups while maintaining data consistency throughout your organization. Whether you need executive summaries, departmental deep-dives, or board presentations, the platform adapts to your communication needs rather than forcing rigid formats. Automated data workflows reduce repetitive tasks and improve information flow speed, allowing teams to focus on strategic work while maintaining accuracy and consistency across systems.
With these automation and customization capabilities in place, your team can finally shift from data compilation to strategic analysis, unlocking the collaborative benefits that come with shared, real-time performance visibility.
From Manual Updates to Strategic Focus
Your performance management team shouldn’t spend their days hunting down spreadsheet updates. When you eliminate manual Balanced Scorecard management, you transform how teams approach strategic work and decision-making.
Your team redirects their energy from data collection to strategic analysis. Staff who previously spent hours monthly gathering information from various sources now focus on identifying improvement opportunities, analyzing performance trends, and developing actionable insights that drive results. This shift enables faster response times when metrics signal problems, allowing you to implement solutions while issues remain manageable.
Real-time visibility creates a shared foundation for strategic conversations. When everyone accesses the same current data, meetings shift from debating accuracy to discussing solutions and improvements. Teams focus strategic planning sessions on interpreting insights rather than questioning whether information reflects actual performance.
Spider Impact automates the entire data collection and reporting process, freeing your team to focus on strategic analysis that drives organizational success. You’ll build more than an efficient reporting system–you’ll create a culture where data-driven thinking becomes the foundation for continuous improvement.